Highlights, Crop Conditions, Export Inspections, Markets & Rain Days Update 9/7/22
- Wright Team

- Sep 7, 2022
- 3 min read
Highlights
Soybeans were hammered from the opening yesterday as Argentina is trying to motivate growers to sell their beans by offering a better exchange rate through September 30th. We thought this was a non-event because it does not change the supply nor the demand for soybeans. It turned out to be a big deal for at least one day. Argentine farmers have been hanging onto their beans to hedge the 60+% inflation. Other analysts say beans were lower due to China’s additional COVID lock-downs.
The numbers:
800,000 mt of soybean sales were made on Monday, highest daily volume since early 2017.
700,000 mt traded yesterday. It is estimated that 13.3 million mt of old crop beans are yet to be sold. It could keep a lid on beans for a week or two, but it does not change the S&D big picture.
IHS Markit updated their yield estimates to 171.6 bu/ac corn (USDA 175.5) and for soybeans at 51.3 bu/ac (USDA 51.9).
Stone X corn yield of 173.2 bpa; beans 51.7.
Allendale corn yield of 172.4 bpa
Russian energy company, Gazprom, told Reuters News yesterday it will not restart the Nord Stream pipeline until Siemens Energy, the German company that was in charge of maintenance, repairs all equipment that needs repairing.
The USDA will update the actual planted and harvested acres for corn and soybeans in the WASDE report next Monday, the 12th. Normally, this is done in October, but they said the data is “sufficiently complete” this year.
IMEA raised the old crop corn production for Mato Grosso 4.65 million mt to 43.8 million. They also increased their new crop planted area by 1.8% to 7.27 million hectares.
AgRural says Brazil’s center-south first corn crop is 9% planted vs 10.1% last year.
Corn ethanol margins in Mato Grosso are negative for the first time in 29 months.
India’s palm oil imports in August were up 94% from July to 1.03 million mt as export limitations of palm oil were lifted by Indonesia and Malaysia. Less soybean oil needed from the Americas.
Malaysia’s palm oil stocks were up 15.8% in August to 2.05 million mt, the first month over 2 million mt since May 2020. That is what happens when exports are restricted.
A La Nina episode brings above normal rainfall to Australia, which is a very dry place. As such, ABARES raised their 2022 Australian canola crop estimate by 1 million mt to 6.65 million, up 12% from a year ago, which was also a La Nina year, but less potent. They raised their Aussie new crop wheat production estimate 2.9 million mt 32.232 million and barley production up 2.4 million mt to 12.254 million.
For the 52 weeks ending August 7th, the dollar value of the primary 178 food and beverage products were higher, but the volume of unit sales were 2.7% lower than the previous year. The numbers shoot holes in the idea that food and beverage demand does not change with price.
Yesterday's charter rate for Capesize ocean freighters was down 21% from last Friday. Panamax down 1%.
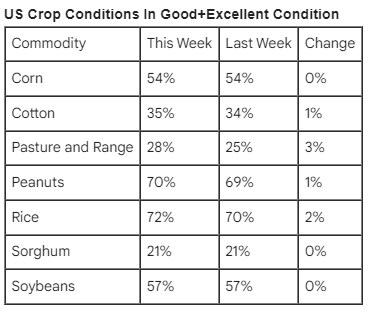
Corn and soybean crop ratings were both 1% better than the market expected (thanks to grainstats.com):

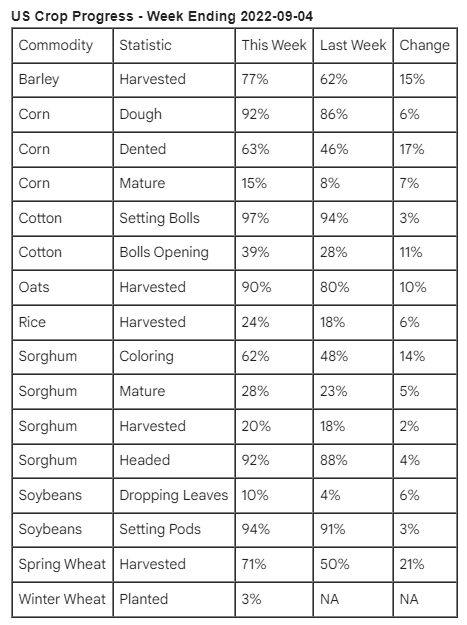
Crop Progress:

Export Inspections Tracker

Market Update
This morning:
Crude oil is at $85.79, down $1.09
The dollar index is at 110.23, up 0.02
December palm oil is at 3,717 MYR, down 99. The contract high was made April, 29th at 6,384 MYR. Palm oil owns 36% and soybean oil owns 28% world market share.
December cotton is at $103.30, down $0.25 per cwt. The contract high was made May, 17th at $133.79 per cwt. Cotton competes with soybeans and corn for acres.
December natural gas is at $8.241, down 0.126. The contract high was made August, 23rd at $10.119. Natural gas is the primary cost to manufacture nitrogen fertilizer.
December ULSD is at $3.4042 per gallon, down 0.0393. The contract high was made June, 17th at $4.0719. ULSD stands for Ultra Low Sulfur Diesel.
September Dow Futures is at 31,136, down 30. The lifetime high is 36,832 on January 5th, 2022.
Rain Days Update
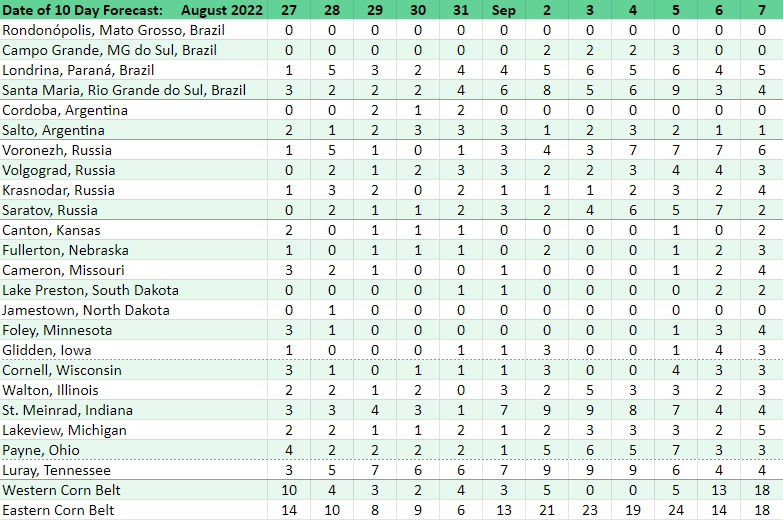
The Western Corn Belt has 5 more rain days in the 10 day forecast than yesterday and the Eastern Corn Belt has 4 more rain days than yesterday.
The 6 to 10 day forecast updated every day at: https://www.cpc.ncep.noaa.gov/products/predictions/610day/

Explanation of Rain Days
Every day, every place in the world has a ten day weather forecast issued many weather services.
By a "place", we mean a Findlay, Ohio; Arcadia, Minnesota; Atlantic, Iowa; Fullerton, Nebraska; Cordoba, Argentina; Craig, Colorado, Saratov, Russia and ten million localities we have never heard of.
The ten day forecast predicts the high and low temperature for each day as well as whether or not rain is predicted for each of the ten days, likewise cloudy, partly cloudy, sunny, etc.
We look at the ten-day forecast and if we see rain is predicted for 4 of the next 10 days, we record a "4" for that location on the chart for the today. It does not matter whether it is one-hundredth of an inch or 5 inches. We realize about half the days expected to receive rain never get rain that day, but we must be consistent in what we report each day and every day because rain makes grain a few key weeks of the growing season. Of course, we scan the temperatures and the amounts of rain just to see if anything is getting way out of the norm.
Want to read more?
Subscribe to wrightonthemarket.com to keep reading this exclusive post.


