Track Exports to Predict Carryover Changes
- Wright Team

- Nov 15, 2022
- 5 min read
Updated: Jul 30, 2024
Let's talk about US Grain Export Inspections and Export Sales
The USA exports about 16% of its corn production, 48% of its soybeans, 52% of its wheat, 75% of its sorghum, and 95% of its cotton. Therefore, it is important that producers and users of these commodities fully understand how to accurately monitor exports.
Export Inspections
Late morning every Monday, the USDA issues its Export Inspections Report. All food and fiber products grown in the US that are loaded and ready to ship to a foreign country must be inspected by USDA to certify what it is and what quantity is on that train, barge or ship. Without the USDA certificate of inspection, that load cannot leave the borders of the USA. Trucks can cross into Canada without an inspection permit.
The purpose of the inspection is a matter of national security to assure we do not nearly exhaust our supplies of affordable food and fiber without the market participants and the government knowing it.
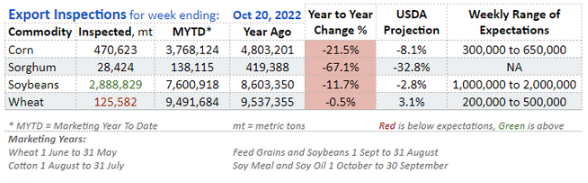
Below is the Weekly Export Inspections report from the USDA issued Monday, 24 October 2022 for the reporting week ending Thursday October 20th. The numbers are for the current marketing year. The beginning date for each commodity’s marketing year is under the chart.

The magnitude of the market impact is determined by what was expected for each commodity versus what the actual quantity was inspected. Many market reporting services (Reuters, Bloomberg, etc) do a survey of market analysts and report the range of estimates and the average estimate the day before the report is issued.
The numbers in the red box are the ones which will impact the market immediately and most likely for only a matter of minutes. Speculative traders are most interested the numbers in the red box. They are usually looking for short term profitable trade opportunities.
Producers and users of commodities are more interested in the numbers in the green box, which have very little impact the day the report is issued, but those numbers are far more important for the long-term price outlook.
Since carryover (how much is left at the end of the marketing year) is the most important market factor above all else, the most important export number is the year-to-date exports compared to what the USDA projects for each commodity. Since the expected numbers for each weekly report are not on the USDA report and the exports the USDA projects for the marketing year is only issued once a month, we issue our version of the export inspections report. It includes the actual export inspections versus what was expected for that day and what export inspections year-to-date are compared to USDA projections from the monthly Supply and Demand Report. Take a look at our report and note the difference from the USDA report above:
Nothing ever happens in an economy until somebody sells something and so it is with exporting commodities.
Export Sales
All grain exporters have salesman in or near every foreign country which buys US commodities. If you were to call Cargill’s home office in Minneapolis to buy 55,000 mt of soybeans to China, you would be told to contact Cargill’s sales office in China. That is where the Chinese deals for US commodities are made.
At 7:30 AM Central Time every Thursday, the USDA issues its Export Sales Report for the reporting week ending the previous Thursday, the same Thursday as Monday’s Export Inspections Report. Below is the Weekly Export Sales Report issued October 27, 2022 for the reporting week ending Thursday, October 20th.
The first chart below is the USDA summary for export sales for the week ending Thursday, October 20, 2022. The red box on the left is the number of metric tons (mts = 2204 pounds) of each commodity contracted (sold) for export during the current marketing year for the reporting week. These are the numbers that will move the market for a few minutes if they are substantially different than what was expected.
The green box on the left is the mts of the various commodities that have been booked for export this marketing year, but have not been shipped. The two columns are labeled “Current Year” and “Year Ago” so one can easily see the difference. You can see the outstanding corn sales is less than half of a year ago for the same date. You can also see the outstanding soybean sales are about 2,000 mts above last year’s pace for this date. If you grow hard red spring wheat, you like what you see in the outstanding sales, but if you grow hard red winter wheat, you are not liking what you see.
The blue rectangle in the middle reports the amount of each commodity that actually left the country for the reporting week. This total will be close to the Export Inspections number on Monday, but it will be different. A ship load inspected on Thursday afternoon is included in weekly Export Inspection, but if the ship left port after midnight Thursday, it would not be included in weekly exports.
The dirty red rectangle is the Accumulated Exports tonnage; the number of mts actually shipped for the current marketing year to date and the previous marketing year to date.
The far-right green box are the sales for the week for the next marketing year and the year to date. This information becomes much more important as end of the old crop year nears.

This year’s unshipped sales and this year’s actual shipments compared to a year ago are important numbers for the cash market producers and users of these commodities, but the most important export numbers are not on this report.
The export sales pace this year versus last year and what change the USDA projects for exports; that is the holy grail.
If you know what percentage of change the USDA projects for the current year compared to the previous year and what the percentage of change actually is running for the year-to-date, then you have a clear picture of what changes the USDA is likely to make in the coming months.
To keep our clients informed of how exports are doing compared to the USDA’s projection for the year, we prepare the following chart every week which combines unshipped sales and actual exports to get total sales to date:

With just a glance, you can see why everyone is bad-mouthing corn exports. Year-to-date corn sales are down 52.7% with USDA projecting a decline of just 8.1%. Gosh, do you think there is chance the USDA will reduce corn exports on the November 9th S&D?
How about sorghum? Soy oil?
With a little inspection, you can readily see the two commodities that will not have a reduction of exports on the November S&D.
One needs to consider how deep into the marketing year we are and unusual events that impact exports. This year, we have low water on the rivers. Last year we had Hurricane Ida hit the Mississippi River ports in late August that kept most of the ships from being loaded until the middle of October.
You can track weekly USDA Export Inspections and sales at:


Comments