Tech Guy Weekend Comments 10/8/23
- Tech Guy

- Oct 8, 2023
- 1 min read
The November Soybean trade on Friday was a good example of how the support and/or resistance numbers work. Funds were selling on Friday, and price came down to within 1.5 cents of the lower support area, bounced up 6 cents and then later sold down a cent or so beyond the 1270 and that held during late morning trade.
Sell stops tend to build up below support levels and sure enough, the afternoon push below 1268 flushed out the sell stops all the way down to 1263. Bias still up.
For Monday:
1st support - 1262, 2nd - 1256.
1st resistance - 1276, 2nd - 1288
Chart of 5 minute beans reacting to a support level:

December Corn settled in between the 493 and 490 support levels on Friday. Bias still up.
1st support - 490, 2nd - 482 - unlikely.
1st resistance - 501, 2nd - 507.
December SRW Wheat closed at the 2nd support level of 569 on Friday.
1st support - 564, 2nd - 551
1st resistance - 582, 2nd - 599.
December KC Wheat also settled at the 2nd support level of 673 on Friday.
1st support - 667, 2nd - 663
1st resistance - 685, 2nd - 694.
December Spring Wheat levels were incorrect on Thursdays report - chart not refreshed. The trade found a new resistance level of 736 on Thursday.
1st support - 718, 2nd 714, 3rd - 707
1st resistance - 734, 2nd - 739, 3rd - 753.
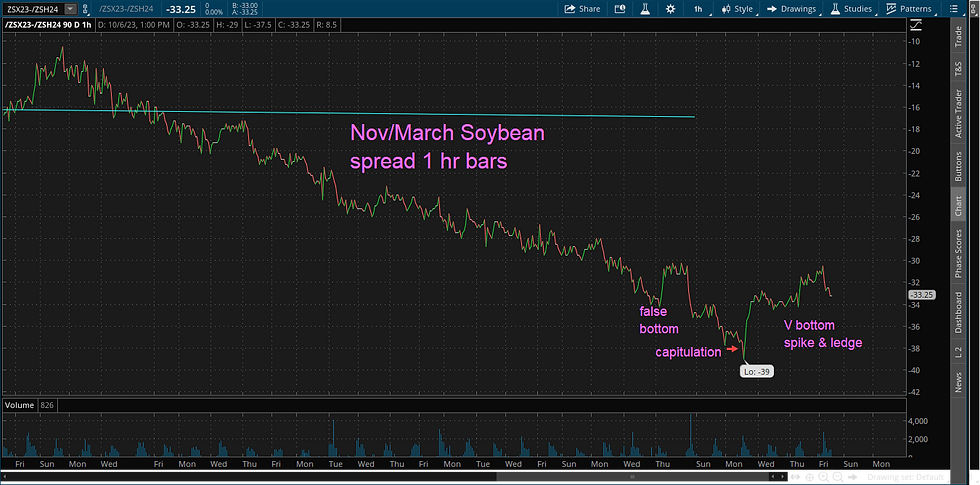
Evidence that the soybean complex has bottomed: Nov/Mar spread - V bottom.


Comments