Tech Guy Opening Calls & Comments 7/19/23
- Tech Guy

- Jul 19, 2023
- 3 min read
Sep Wheat - 2 to 3 Lower
Dec Corn - Steady to 1 Lower
Nov Beans - 5 to 8 Lower
December Corn wasted no time today marking another up leg. Because we are within an impulse higher, we expect the structure to be at least 5 waves (legs), and since wave 3 terminated today, we should have 1 more leg higher that terminates between 588 and 600.
The duration of the corrections that have been occurring thus far are 1 day or less. After December Corn rallies to 588 to 600 it will mark a backfill of 2-3 days in duration, because wave 1 (Big 1) should be completed.
As you know, smaller 1-2-3-4-5 counts comprise larger waves. We don't know for sure yet, but after December Corn rallies to 588-600, the ensuing correction or pullback should take 2 to 3 days to complete and could backfill or sell off as low as the 550 to 540 price area.
We can estimate the length of the next mini rally because we know the lengths of wave 1 and 3, 45 and 62 cents respectively. The Elliot rule is for wave 5 to generally be between the lengths of 1 and 3.
Check out the December Corn 2 hour chart, breaking down the details being discussed here.

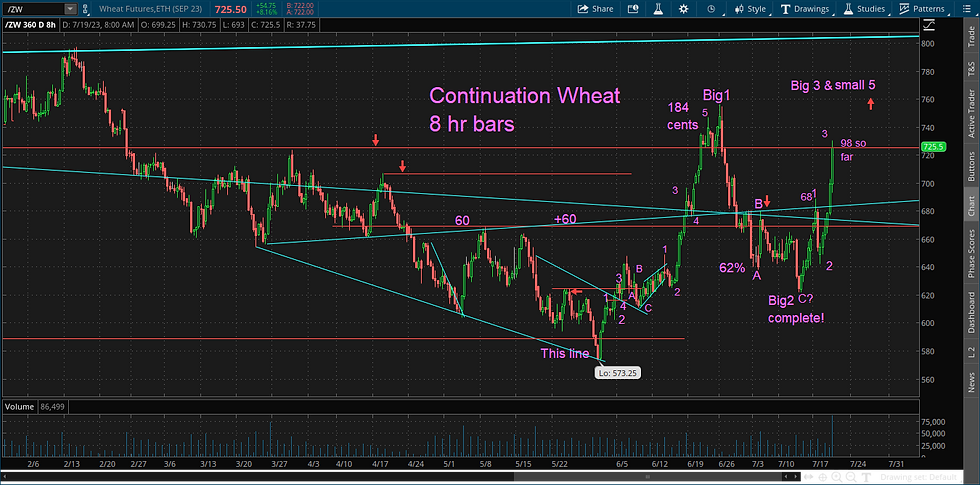
September Wheat is marking a very similar impulse higher and rallied within a nickel of touching limit up today. Like corn, wheat painted wave or leg 3 today. Also like corn, wave 3 was longer than 1.
Therefore, we are looking for wave 4 correction for tonight and possibly into the day session tomorrow. Wave 4 can correct down as far as the top of wave 1 at 689, but with the intense buzz in world news right now, 710 to 700 will likely hold as buying support.
Sometimes when a commodity market is very bullish, wave 5 can exceed wave 3 in length. For September Wheat here, I expect the next rally will mark up to 800 to 810, then, again like corn, the correction after 800-810 should last 2 to 3 days.
Corrections do not have to sell off much. Sometimes they simply mark time by trading sideways in a range. Here's the updated September Wheat 8 hour chart.

November Soybeans traded up through the big upper, descending triangle line today, remaining above the neckline, but closing just a couple of cents below that trendline.
The Elliot wave count in Soybeans is not as straight forward as corn and wheat, but the pattern is a well structured, bullish inverted head & shoulders. While these patterns are very similar to the upper area of human anatomy as far as the head and shoulders are concerned, the neckline is out of place.
In human's, the neckline is above the shoulders. In chart analysis, the neckline is below the shoulders on a bearish head & shoulders pattern. I am remembering it took me awhile before I understood all the points in this pattern, probably because of the anatomy quandary.
Here is today's November daily soybean chart.

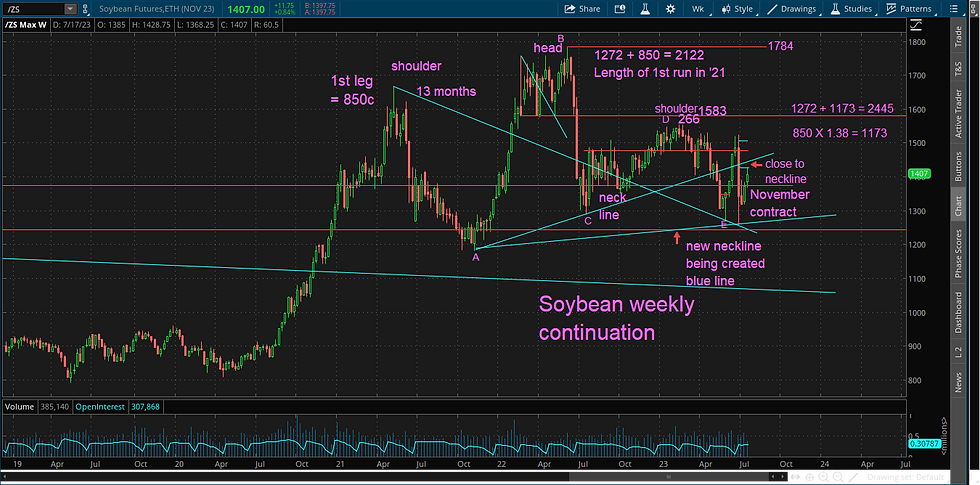
Roger told me one of our clients saw a bearish head & shoulders pattern on the weekly soybean chart. I see it also! Therefore, we have competing forces occurring in beans.
The August daily inverted head & shoulders has good up pressure, but it's close to trading near the neckline, which is resistance on the weekly. The current result then is a neck and neck battle between the bears and bulls.
First of all, these patterns are more reliable when the right neckline is below the left, creating a downtrend line. The bean weekly neckline is trending up - it is a weaker pattern. I believe the current dailies are stronger than the weekly pattern currently. We will have to let it play out.
Here is the kicker - both of them could be correct. November could rally to 1600 or 1700 and the weekly bearish head & shoulders would still be intact. The target for the weekly pattern is 545 cents below the neckline.
In September, for instance, the weekly neckline hits price at about 1460. 1460 minus 545 equals 915!! Therefore, the bean complex could have a very interesting year - maybe price breaks down, but is not able to sell off the entire 545 cent target?
There is a support trendline that crosses price about 1060 in January 2024?
Here is the bean weekly chart. I hope you can see the patterns on both the daily and weekly charts. Thanks for bringing this to my attention.


Comments