
Tech Guy Corn Comments 4/5/26

Happy Easter!
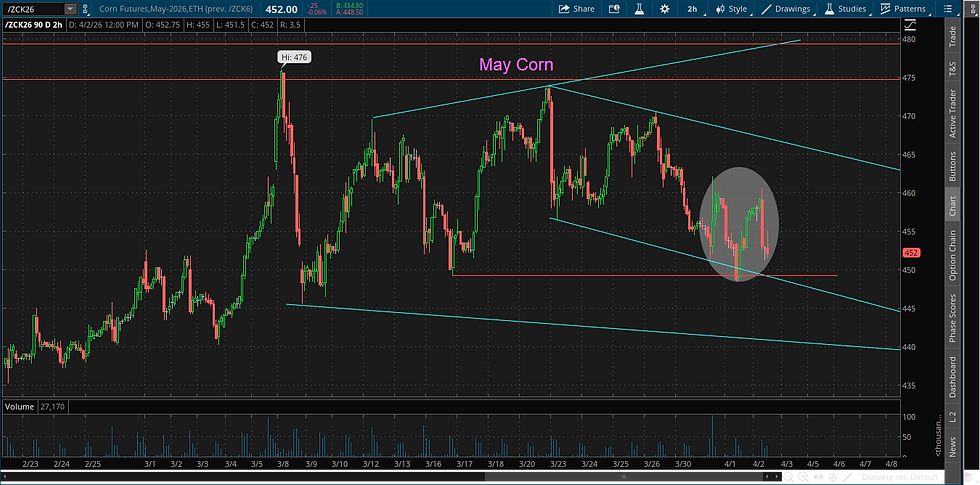
May Corn has been in a trading range for about 3 months now, between 445.0 and 475.0. On April fools day, corn tested near the lower part of the range at about 445.0 and formed an inverted head and shoulders pattern which projects a rally back to the upper part of the range to about 474.0. You will see this pattern highlighted on the chart. There is no technical evidence at this time that corn will be able to rally above the 475.0 to 480.0 level.
Technical analysis is primarily trendlines, parallel lines and price levels, therefore please take some time studying the May Corn chart.
USSR:
The Soviet Union asked in June 1972 to buy a large amount of U.S. wheat on a three-year deal. An agreement was made for the U.S. to sell the Soviet Union 10 million mts (364 million bushels) of wheat over the next three years. However, the entire tonnage was purchased by the Soviets in July and August 1972 from the ABCD companies (Commercial Grain). Since the U.S. government was not tracking the export sales and shipments of U.S. food and fiber exports, very suddenly, there was not enough wheat to meet the domestic demand. The price of wheat jumped 30% for American consumers.
For pertinent news and fundamental grain market information, sign-up for a 30 day, no cost, no obligation, no phone call subscription to Wright on the Market news sent to your email every day before you get out of bed. Click on "subscribe" at: https://www.wrightonthemarket.com/


Comments