Tech Guy Opening Calls 02/27/2022
- Wright Team

- Feb 28, 2022
- 2 min read
May Corn 25 to 30 higher
May Beans 20 to 30 higher
May Wheat 75 higher
The first chart below is the corn continuation chart. Note the three different uptrend lines just above the arrow. Each one reflects the trend for a shorter period of time. Corn settled sharply lower Friday, yet stayed above all three uptrend lines. That is strong!

Three weeks ago tonight, the soybeans gapped higher. We all wanted to know if it was a “measuring gap” or an “exhaustion gap”. I had written we would know by Friday of that week.
“Measuring gaps” are like how many miles to a given town along the interstate only we are talking cents to next peak in price.
“Exhaustion gaps” tell us the uptrend has run out energy and the rally is over. It is like seeing a sign that says the next gas station is 532 miles after you passed a gas station 30 miles back.
The gap made three weeks ago turned out to be a measuring gap and the measure projected the next high would be in the area of $17.75. Thursday's high was within 16 cents of the first gap target. See the chart below.
We adjusted the leg/wave count to Thursday’s high of $17.59¼ labeled “3” (green circle) and low on Jan 18 remaining the “2” point (yellow circle).
The 2-3 leg (red horizontal lines) is $4.09 (far right arrows). Friday’s low of $15.79 was a 44% correction of that leg, which is labeled “4” (red circle).
The beans could sell down to $15.54 before the 4 leg is complete; $15.54 would be a 50% retracement, which is a pretty standard retracement of any move.
After the “4” move is complete, the market will begin next move up, which its peak will be marked as wave “5”.
If I am wrong on the above, soybeans could sell down into next supply/demand line on March 9th around $14.72.

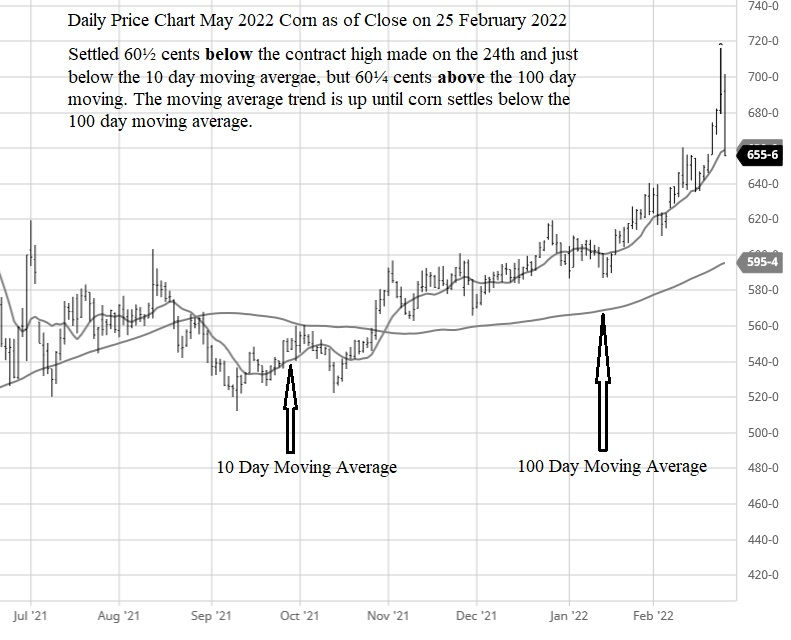
A couples days ago, Roger wrote that corn could decline $2.20 and still be in an uptrend. His math was a bit off; it is just $1.20 and still be in an uptrend, which is very impressive, none-the-less.

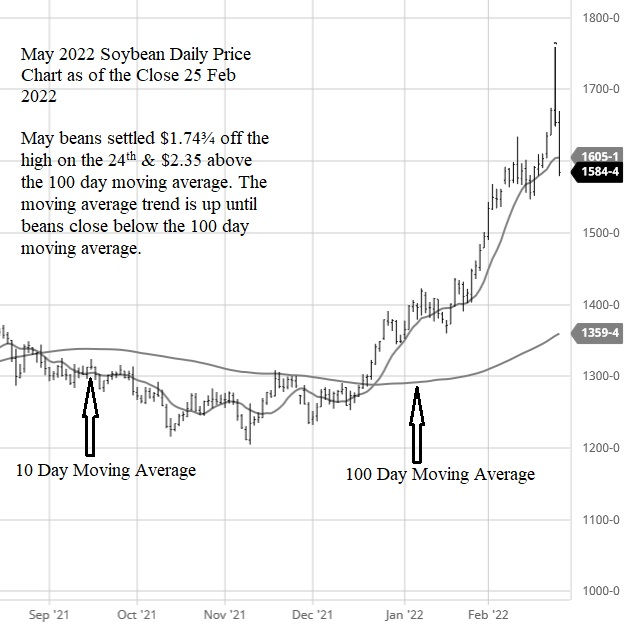
Speaking of impressive, May soybeans can decline $4.10 and still be above the 100 day moving average!


Comments