Tech Guy Opening Calls & Comments 4/4/23
- Tech Guy

- Apr 4, 2023
- 4 min read
May Wheat - 1 Higher
May Corn - 1 to 2 Higher
May Beans - Steady
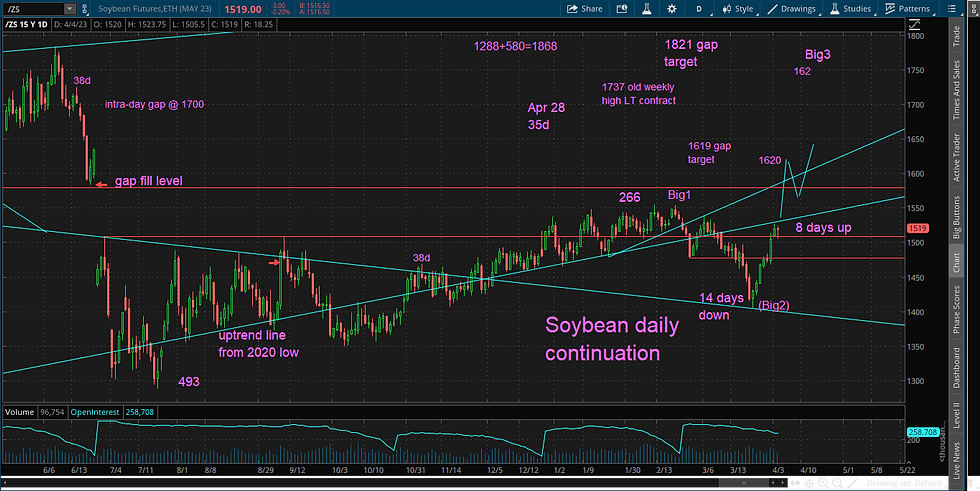
The 1511 support in May Beans was temporarily violated, but price reversed back up above this level within 2 hours to close at 1519. It usually is a bullish sign when a market is able to close above important support areas. A true violation is a close below support.
Since March 6th, May Soybeans has sold off from 1538.5 to 1405, and has rallied back up to 1527.75. It took beans 14 days to sell off and 8 days to rally back - it will be 9 tomorrow if beans can rally to 1538.5.
The point here is that May beans are more in a hurry to rally - there is more up energy than down. Also, take a look of the amount of overlap of the bars (bars side by side) on the selloff, then look at the lack of overlap going up. The difference in days and overlap or lack thereof are 2 bullish indicators worth noting.
Here's today's May bean daily continuation chart with the 1619 target and subsequent correction down to 1565 marked with blue lines.

The May/July Soybean spread is continuing to mark new highs indicating that the May shorts are getting squeezed and that the bullish energy is continuing to ramp up. To be more clear, this spread represents buying the May contract and selling the July. End users are going to have to pay up to secure enough product.
Producers are in control because of the large amount of available stocks in their hands compared to the commercials and this fact is revealing itself through this May/July bean spread. Look at this spread chart going parabolic.

After a corrective selloff in May Corn today, the buyers were waiting near the second level of support at the 649 level. It is interesting that on the corn daily chart, price is consolidating/rotating around the big upper triangle line and the July 11th 2022 high which marked the top of the summer range of prices.
The trend in May Corn should continue up, with numerous targets/resting levels up above. First we have the 695-700 level, then 731, 745, and 782. The last target would be the closing of the large gap from last June. All of these target levels are possible within the next 8 to 12 weeks. Check out the updated corn continuation chart and note where these upper target levels are located. Also, I have drawn in with blue lines a possible path for May Corn in the coming weeks.

The 691 support was violated by 3 cents on May Wheat, indicating a possible test of 680, however this may be unnecessary as wheat tries to find it's equilibrium. It will have to find some fund buyers to test the 724 neckline in order let us know it wants to rally. I will follow up a May wheat chart tomorrow.
May Crude Oil consolidated between 81.75 and 79.50 today - it was unable to test the bottom of the gap at 78, indicating eager buyers. At this point it appears crude will not test the 78 area, but we will keep this price in mind just in case. Here is a 1 hour crude chart for a zoomed in look.

There are 4 basic types of orders you can place in the futures markets. A buy or sell market order gets you in or out of the market right now at the current trade price. A limit order gets you in a market only at a specific price - a buy limit is placed below the market and a sell limit is above.
A stop also gets you in or out at a specified price, but likely with slippage. When a stop price is elected your order becomes a market order - a buy stop is above the market to exit if you're short or enter if you want to get long and a sell stop is below either to exit a position or enter a position on say, a breakout.
"Buy beans on a 1515 stop." 1515 prints, then 1515.50 - the second price is your fill.
A stop-limit order is to enter or exit with 2 prices specified. Here's an example. "Buy May Beans on a 1515 stop - 1516 limit." When the market prints the 1515 price, your order is elected. Say the next trade is 1515.50 - you would be filled at 1515.50. What if you are trading September Beans which is a very thin market with the same order, but prices are screaming higher. 1515 prints. the next trade is 1517. In this case your order would not be filled.
Please send us an email if you have any questions about what I write, technical analysis in general, or if you want more details about a topic or market which interests you. Also, please let me know what you would like to hear more about or if you need something cleared up, or basic questions like how markets work or why something is the way it is, etc. Thank you


Comments